Blood Sugar Levels Charts
Key Takeaways
- Understanding blood sugar levels is vital for diabetes management.
- Charts provide a quick reference for normal, high, and low blood sugar ranges.
- Tracking blood sugar levels helps in identifying patterns and triggers.
- Regular monitoring using various devices can improve health outcomes.
Monitoring blood sugar levels is crucial for those managing diabetes. Charts and tools facilitate a better understanding of these levels, making it easier to identify patterns, manage diet, and effectively communicate with healthcare providers. In this article, we will explore different blood sugar level charts, tools for tracking, and best practices for understanding your blood sugar fluctuations.
Understanding Blood Sugar Levels
Blood sugar levels refer to the amount of glucose present in the bloodstream. It is essential to maintain these levels within a specific range to ensure optimal health. Below is a general breakdown of blood sugar ranges.
| Time | Normal Range (mg/dL) | Pre-diabetes Range (mg/dL) | Diabetes Range (mg/dL) |
|---|---|---|---|
| Fasting (no food for 8 hours) | 70-99 | 100-125 | 126 or higher |
| 2 hours after eating | Less than 140 | 140-199 | 200 or higher |
| A1C Test (% of hemoglobin with sugar) | Below 5.7% | 5.7% - 6.4% | 6.5% or higher |
Types of Blood Sugar Level Charts
Various charts help visualize blood sugar levels. Here are a few essential types:
Daily Blood Sugar Log Chart
This chart tracks blood sugar levels throughout the day to identify patterns.
Glycemic Index Chart
This chart lists foods ranked by their effect on blood sugar levels.
Blood Sugar Trend Chart
Used for tracking long-term patterns of blood sugar fluctuation.
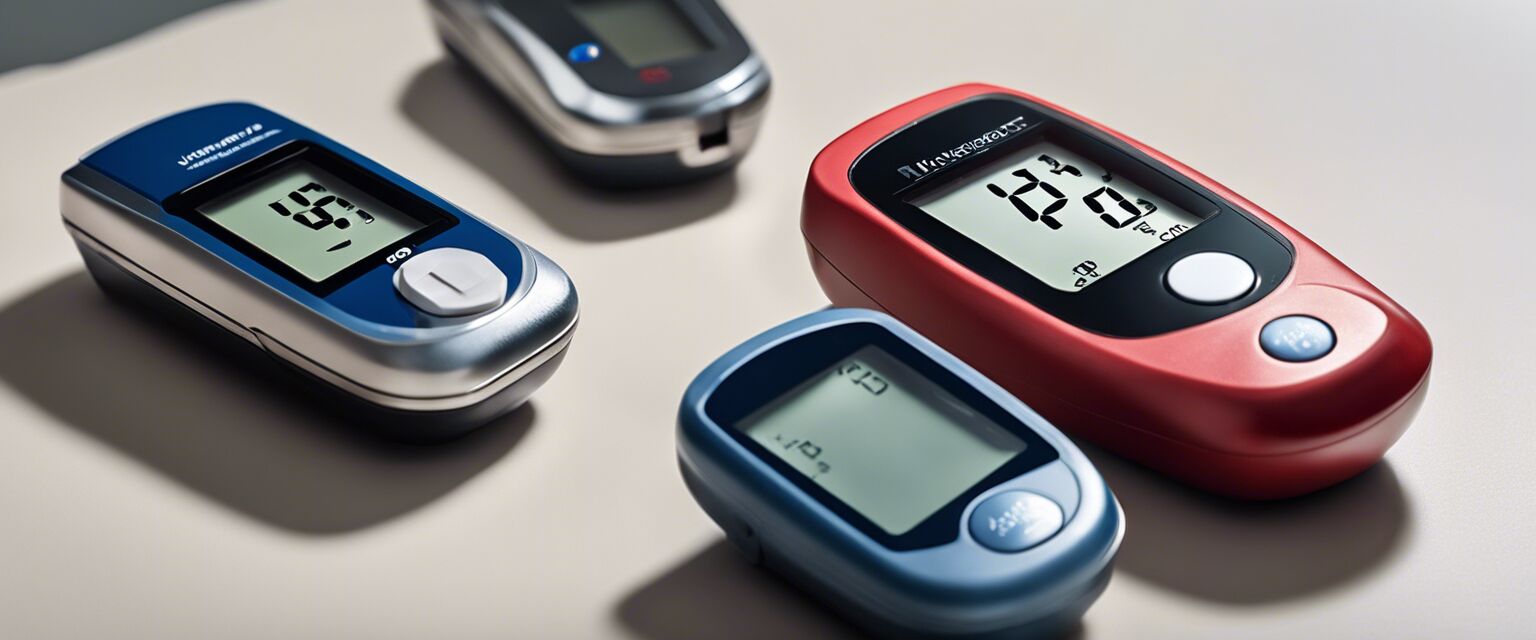
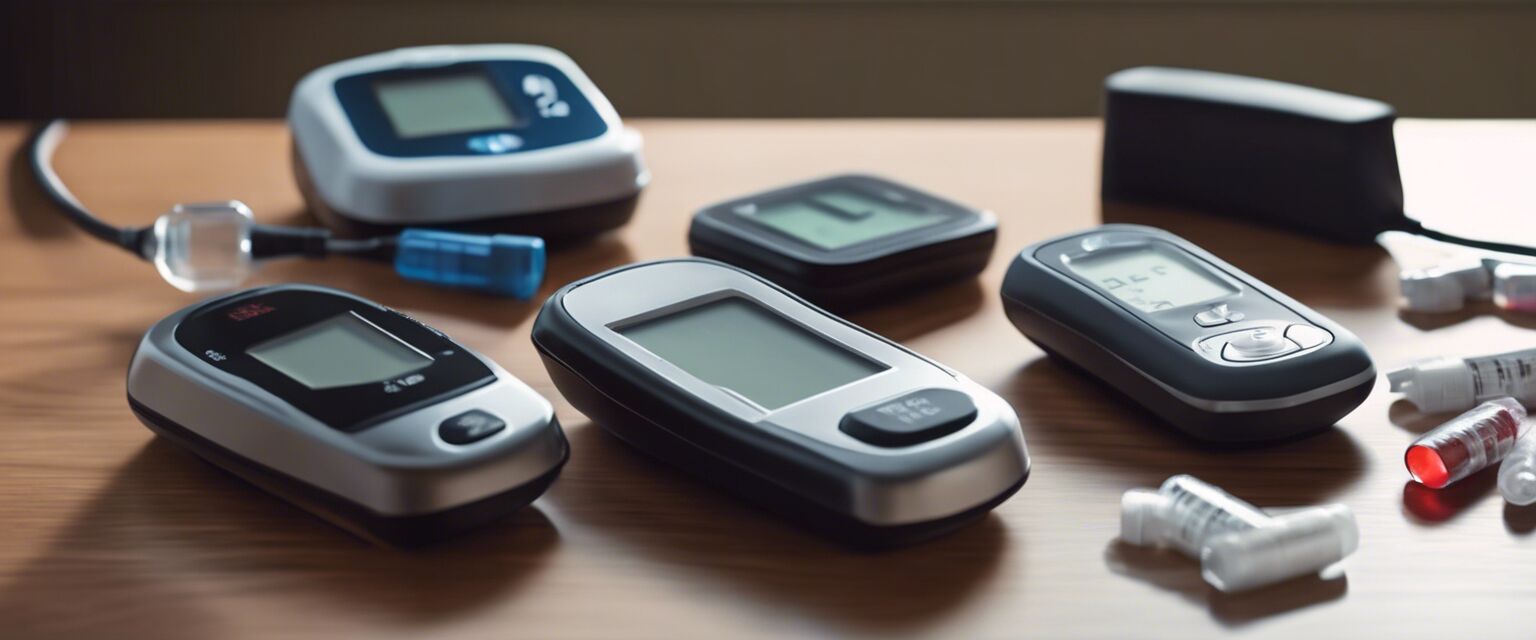
Comparison of Blood Sugar Monitors
Different monitors can impact how you track your blood sugar levels. It's important to choose a monitor that suits your needs. Here is a comparison:
| Monitor Type | Pros | Cons |
|---|---|---|
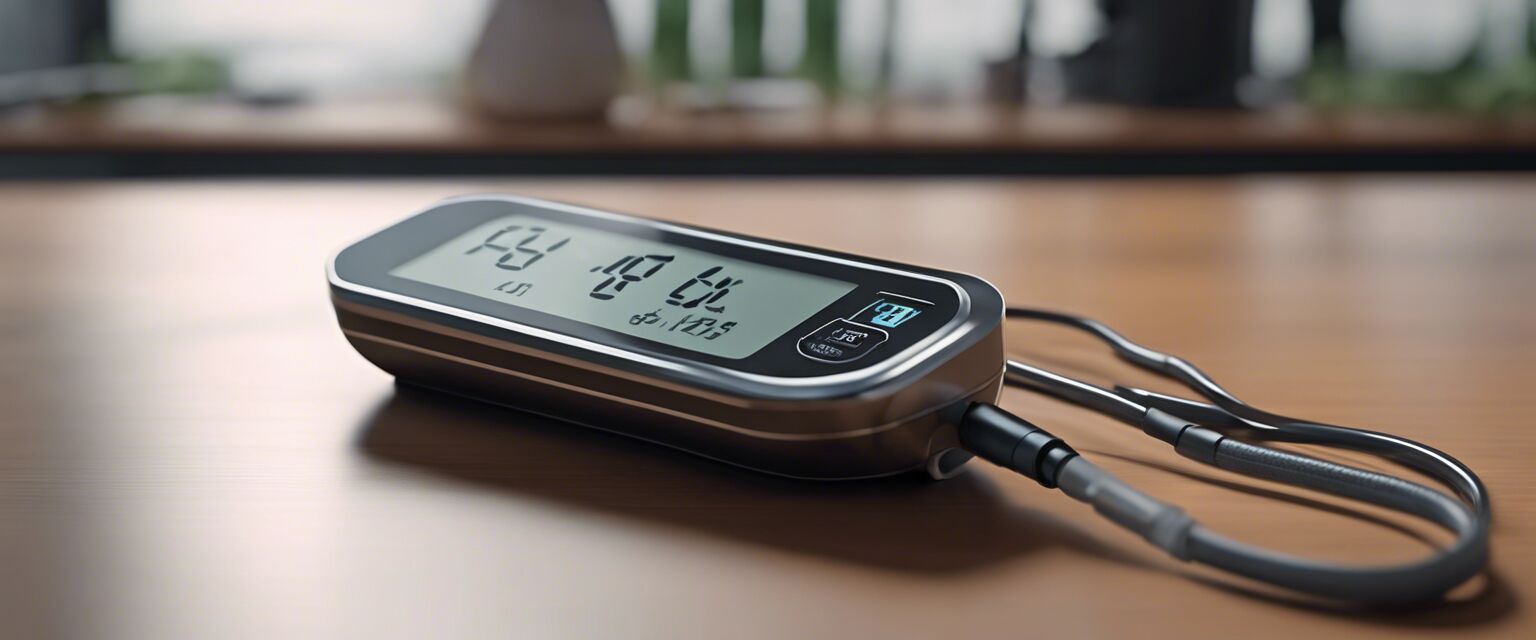
| Portable Glucometers | Easy to carry and quick readings | Requires blood drop for each test |
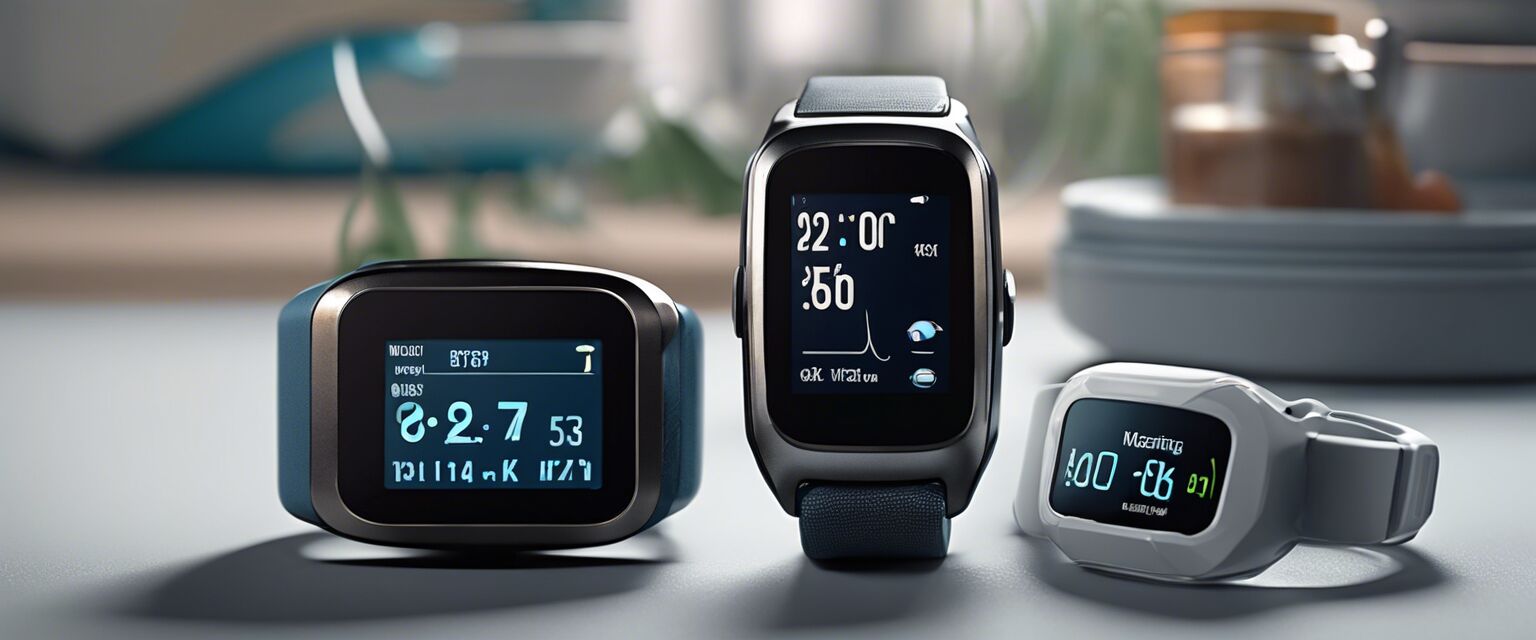
| Continuous Glucose Monitors (CGMs) | Real-time tracking and alerts | More expensive and requires calibration |
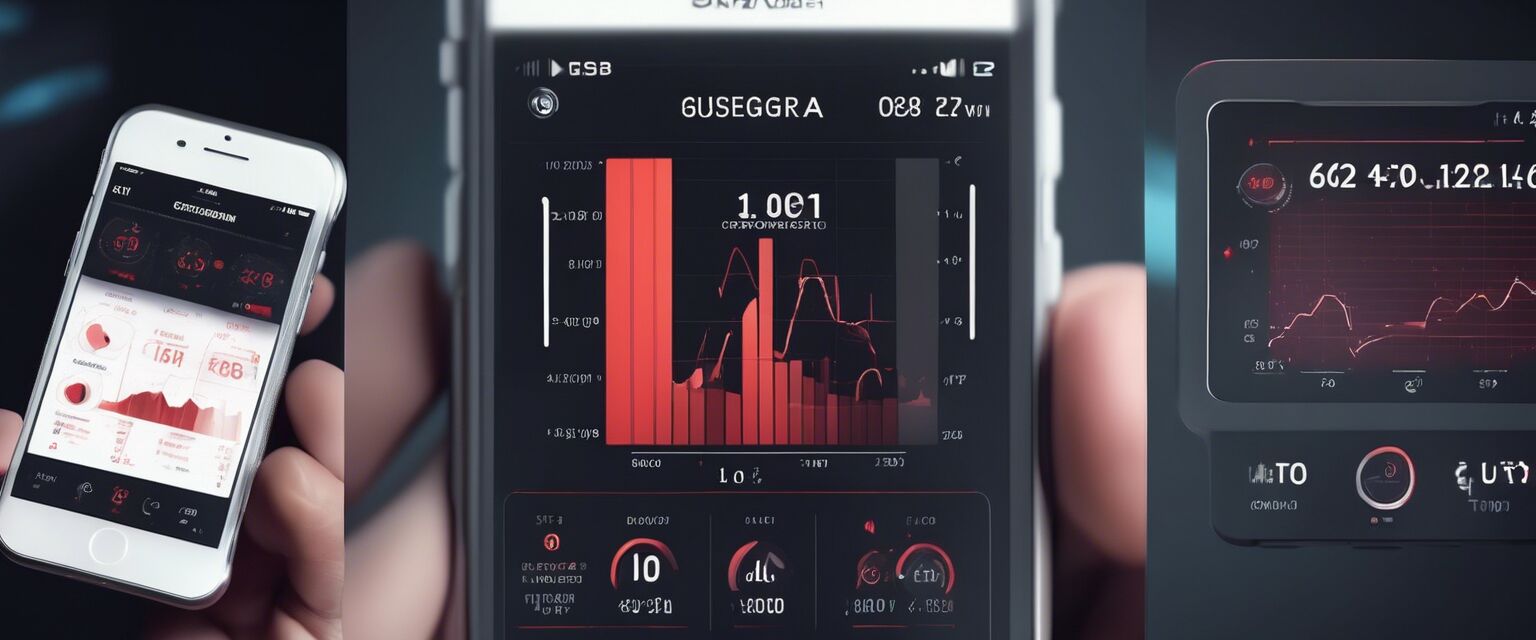
| Smartphone-Compatible Monitors | Convenience of using mobile apps | Dependent on battery life and connectivity |
How to Effectively Use Blood Sugar Charts
To get the most out of blood sugar charts, follow these practices:
- Keep your charts updated daily.
- Identify and note any spikes or drops in levels.
- Discuss trends with your healthcare provider.
- Adjust diet and medication based on your findings.
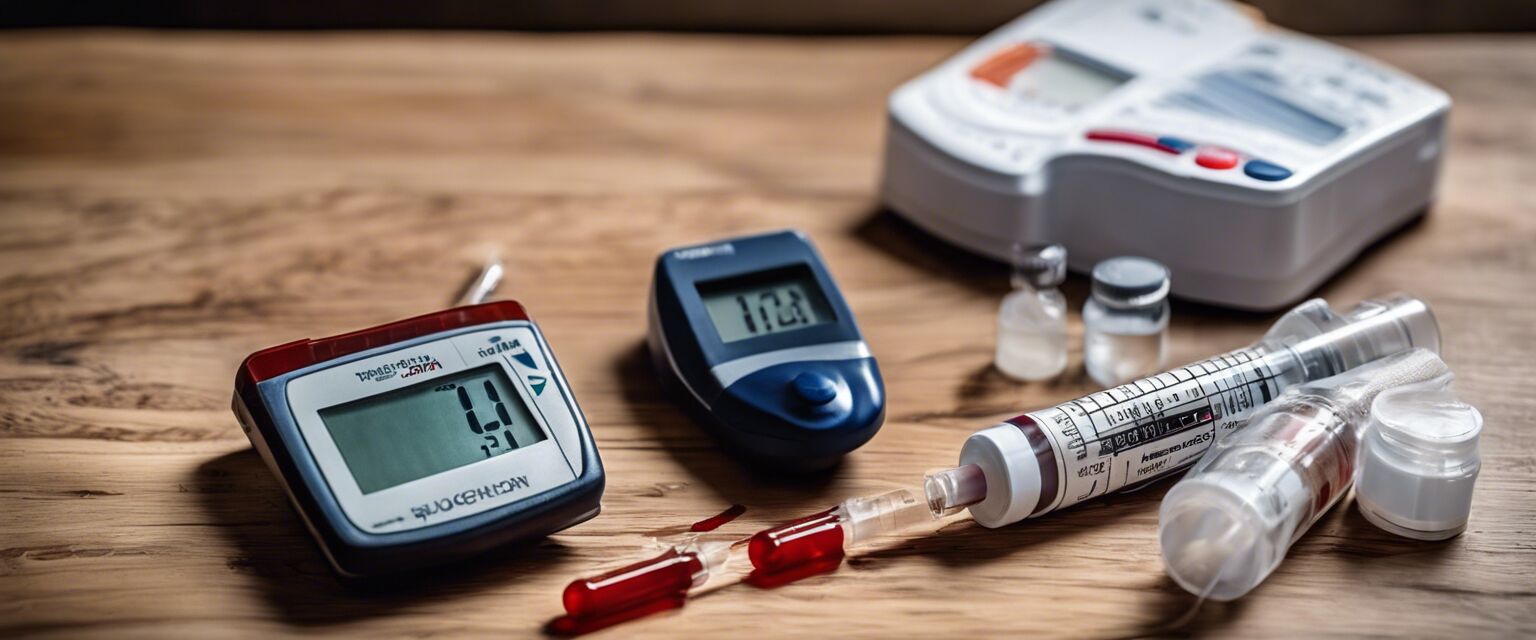
Tools for Tracking Blood Sugar Levels
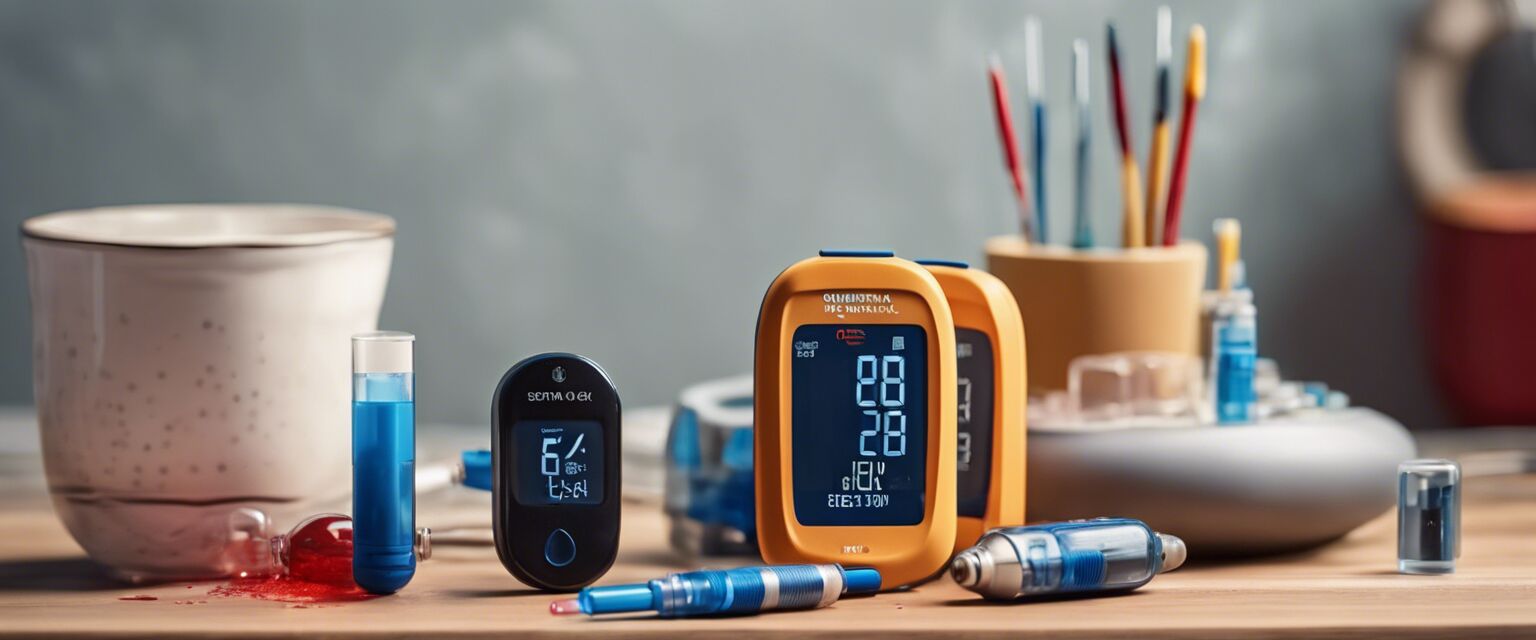
Besides charts, various tools help in tracking blood sugar levels more accurately.
Beginners Section
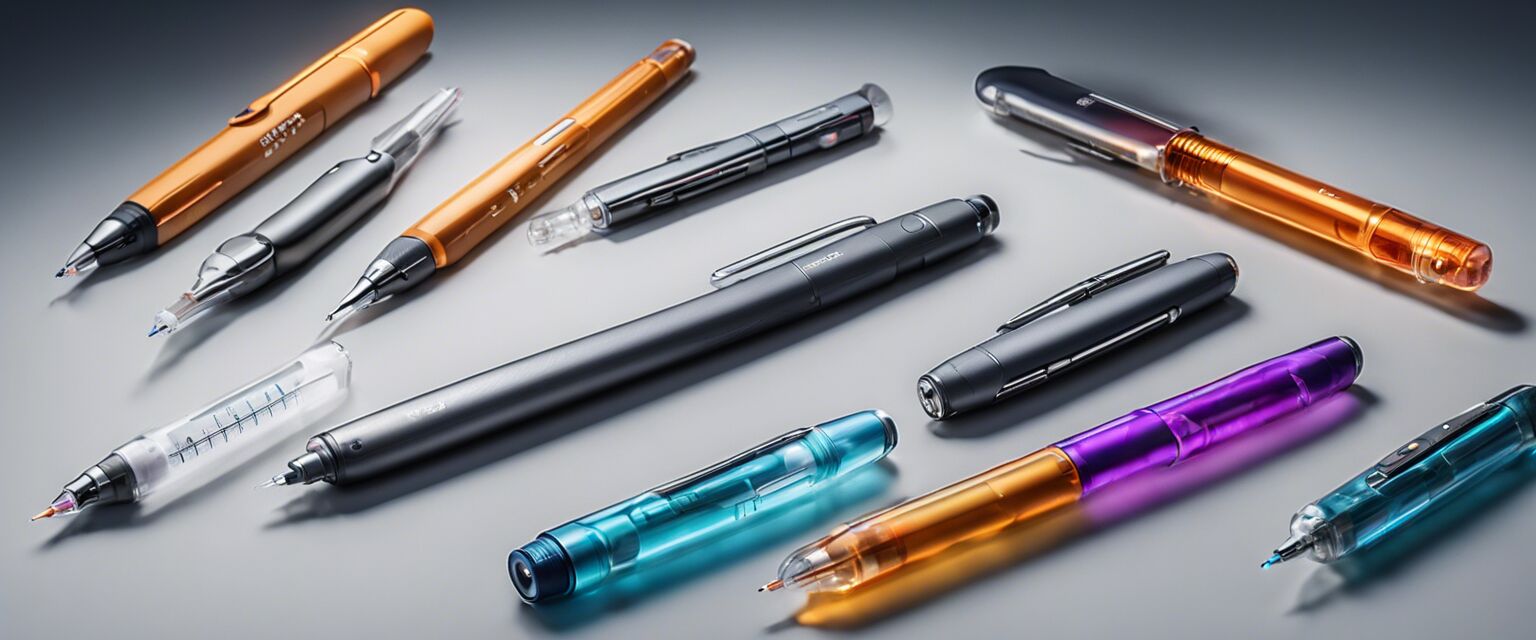
- Consider using a portable glucometer for quick checks.
- Explore continuous glucose monitors for long-term tracking.
- Utilize apps that sync with devices for easier record-keeping.
Conclusion
Understanding and monitoring blood sugar levels through charts can make a significant difference in managing your health. By staying informed and regularly checking your levels, you can take proactive steps towards your well-being.
Pros
- Provides quick reference to normal blood sugar levels
- Helps identify trends and fluctuations
- Charts can guide dietary decisions
Cons
- Requires consistent tracking for accuracy
- Can be confusing without proper education
- May require additional resources for comprehensive analysis